|
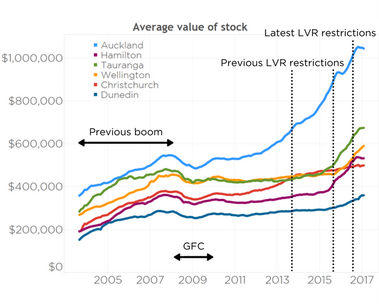
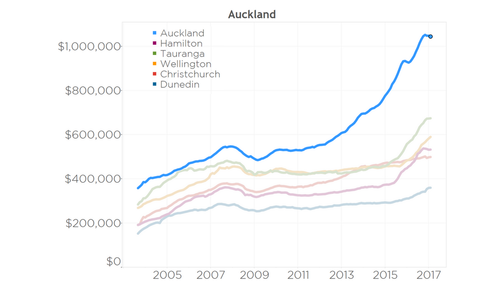
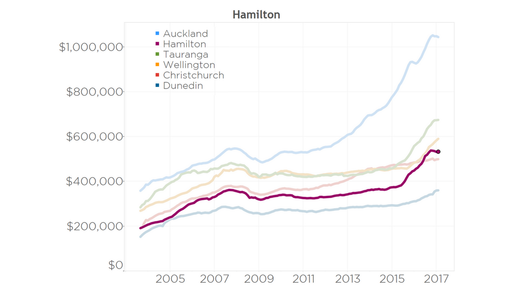
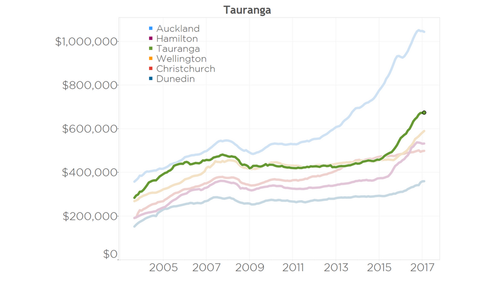
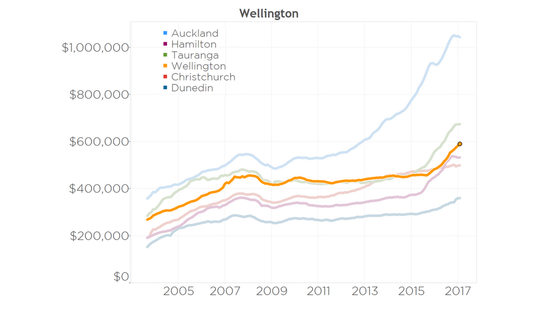
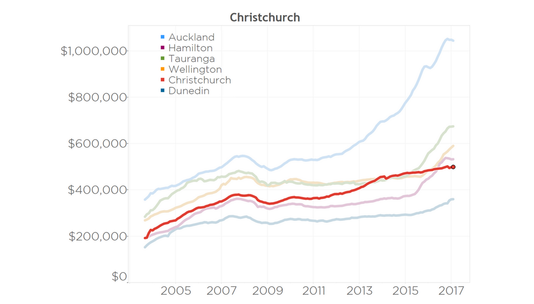
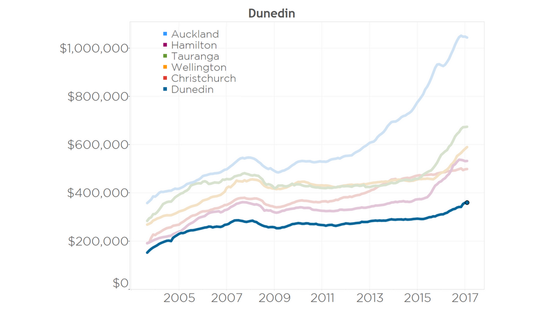
03 March 2017 The latest monthly QV house price index confirms that values are continuing to drop in Auckland and Hamilton, and their rate of increase has slowed considerably in most other areas around NZ. Delving into those index figures though, what’s really going on? And can history teach us anything? The reported drop or slowdown is reflected in the chart below. This shows the average value of the housing stock in our six main centres (based on the house price index) from 2003 to the present. Over the past 14 years we have seen values rise to a peak in 2007, before the Global Financial Crisis (GFC) knocked them back for a year or so. Values rebounded in most main centres during 2010, then remained flat for several years before rising in Auckland from 2012 and elsewhere from 2015. Lending restrictions were first imposed by the Reserve Bank in 2013, more were added in late 2015, and the latest round introduced in late 2016. These most recent restrictions (announced by the Reserve Bank in July and in full effect by October) seem to have taken some of the former heat out of rising values. Looking at each of the six main centres in detail reveals some interesting differences: Auckland In Auckland, the average value of housing stock reached a new peak of just over $1.05m in November 2016. Since then, the average value of a dwelling has dropped by just under $8k, or 0.7%. This dip in values is in stark contrast to the rise of $118k or 13.6% in the 9 months before that November peak. It looks very similar to what we saw in early 2016, when a previous round of LVR restrictions saw values in Auckland drop by 0.8% over the course of two months, before then taking off again. Much of the dip in values can be attributed to the LVR restrictions making it more difficult for people, especially investors, to secure mortgages. The big banks have also tightened up their lending criteria. Against all this we’ve got strong net migration, high consumer confidence, mortgage interest rates at historic lows, plus a persistent housing shortage in Auckland. It’s hard to see how values can drop much further. Our call is that it’s likely that values will begin to rise again in a few months, just like they did in response to the previous round of restrictions. This time though - the rate of increase will likely be much less. Hamilton Just like Auckland, values in Hamilton have been dropping in recent months. The average value of housing stock in Hamilton peaked in October last year at $537k, and has since dropped 1% or just over $5k. That’s a huge turn-around when you consider that values in the year to October last year increased by a staggering 25%, or $108k. Some of the cooling in Hamilton is likely to be due to a decline in the number of Auckland investors purchasing in Hamilton. CoreLogic’s analysis shows that a year ago those Auckland investors were making up 18% of all the sales in Hamilton, but by January that had dropped to 10%. The huge increase in Hamilton values made the investment less compelling compared to a year earlier, and the tightening of lending to those investors will also have curbed their ability to purchase, even if they wanted to. Our analysis also showed that those Auckland investors tended to pay a significant premium compared to other buyers, so with their activity dropping it is no surprise at all to see Hamilton values ease back a little. Tauranga The average value of housing in Tauranga reached just over $672k in December 2016. In the previous year it had risen a hefty 24%, or $130k. In the past two months that rapid increase has disappeared, with values flat during that time. Our CoreLogic weekly buyer demand data shows that this time of the year is much weaker than it should be: clear evidence that the lending restrictions are knocking a significant number of potential buyers out of the market. A drop in demand would normally translate into falling values, so expect the next few months to remain weak. Wellington The lending restrictions are not yet having a major influence on values in Wellington. In the three months to February 2017 the average value of housing stock across Wellington increased by 4.3%, or $24k, to $590k. In the three months to September 2016 this was increasing much faster at 7.1%. The lending restrictions have therefore slowed the increase slightly but not yet to the extent that we are seeing values dropping like we are further north. Our analysis at CoreLogic shows that first home buyers are increasingly active in the Wellington region, particularly a little further out from Wellington City in Porirua and the Hutt Valley. Buyer demand is also at record high levels in Wellington but the number of properties listed for sale has dramatically dropped compared to this time last year. It all adds up to continued upward pressure on Wellington prices. Christchurch Following the devastating earthquakes in 2010 and 2011 in Christchurch, there was a shortage of housing supply. This led to values increasing from early 2012 to late 2014 at a time when Auckland was the only other part of the country increasing significantly in value. From 2014 on, values in Christchurch have increased at a very slow pace, around 3% to 4% per year. It was the only main centre to not increase rapidly during the second half of 2015 and 2016, probably as a result of the post-earthquake increases of 2012 to 2014. In the past three months, Christchurch values have dropped by 0.5% or $2,500 from their November value of $501k. The CoreLogic weekly data shows that buyer demand continued to drop since the LVR restrictions were announced in July 2016. A normal seasonal pattern would see demand much higher at this time of the year. This drop would suggest that values may stay flat or dip slightly over coming months. Dunedin Like the other main centres, it appears as if values in Dunedin are not increasing as quickly as they were during 2016, when they grew by $52k, or $1,000 per week, to reach $354k in December. In the past month, Dunedin values have hardly increased at all. Too early to call it a lasting trend, but interesting to note that while buyer demand was exceptionally strong throughout January 2017, there was a significant decline in February. That could be due to the announcement of the impending closure of the Cadbury factory in Dunedin. That drop in demand will likely flow through to fewer sales and less upward pressure on Dunedin prices. So, that’s your property history lesson for this week. As you can see the strong increases in value evident throughout 2016 seem to have come to an end. However history also tells us that intervention in the form of lending restrictions tend to have only a temporary impact.
We are having a general election in September this year. While elections in themselves don’t always cause alarm amongst home owners, the potential for a change in Government to one with differing views on housing policy may do. As a result we expect considerable uncertainty in the market until the dust settles on the election. It is also likely that when next summer rolls around, the strong upward forces of high migration, low interest rates, and a housing shortage will once again lead to increasing prices. Just expect winter to be quiet. Source: CoreLogic RP Data
0 Comments
Your comment will be posted after it is approved.
Leave a Reply. |
Archives
July 2017
Categories |
 RSS Feed